
Built for investment research and strategy
Bring research, financial data, and key insights into clear, professional presentations grounded in evidence.
Examples
Make your analysis clear.
Each group below is made of pages we actually produced: real layout, real charts, not a collage mock-up. Switch between cases, or enlarge a page to read it.
Page 1 / 4
Product roles and customer revenue
Product roles and customer links sit on the left; three customer types are compared on one revenue scale on the right.
Choose a case
Three pages on where growth comes from: services lifting the total, how customer revenue splits, and how fundraising compares with peers.
Open the full HTML deckOpens the archived deck in a new tab. The archived deck holds the complete set of pages for that theme, which is more than the selection shown here.
Fictional test data — not a real disclosure or research conclusion of any institution.
Original illustrative example · fictional data. Institutions are named to describe the layout reference only, and do not endorse this work.
Capabilities
Evidence behind every slide.
Three things happen on every page: the relationship is made visible, the evidence is kept, and a revision stays inside one page.
Make the relationships clear.
Revenue mix, growth drivers and business relationships get the chart and structure that fit the content, instead of one template applied everywhere.
In the examples, revenue mix uses stacked columns, the customer split uses a shared horizontal scale, and rate transmission is drawn as three steps ending in a conditional outcome.
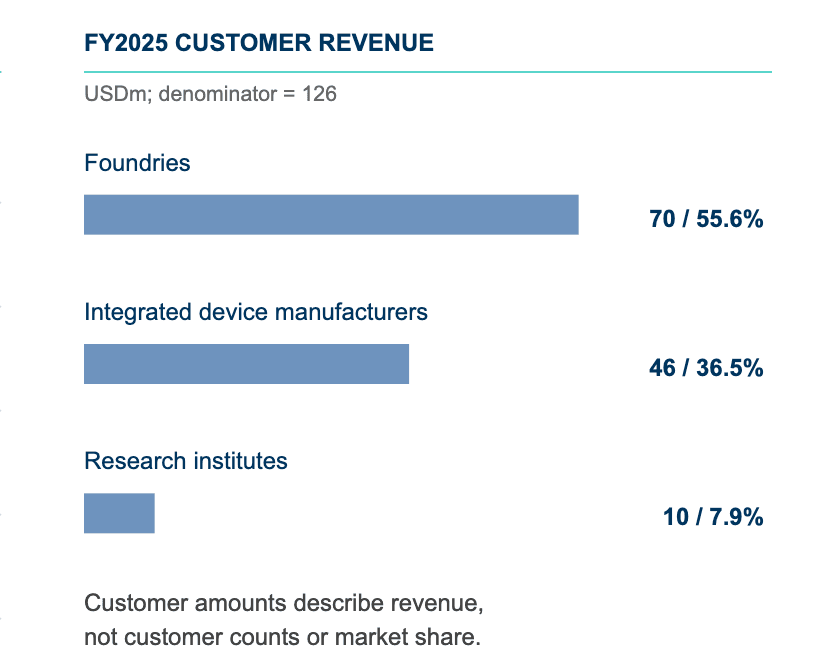
From the growth example: three customer types share one scale, with the denominator written above the chart. Keep the evidence in view.
Source data, calculated figures and analytical judgement are kept apart, so a reader can trace each number back.
Example footers state what the data is and where the basis comes from; the body distinguishes a calculated figure from an undisclosed one instead of filling the gap with an estimate.
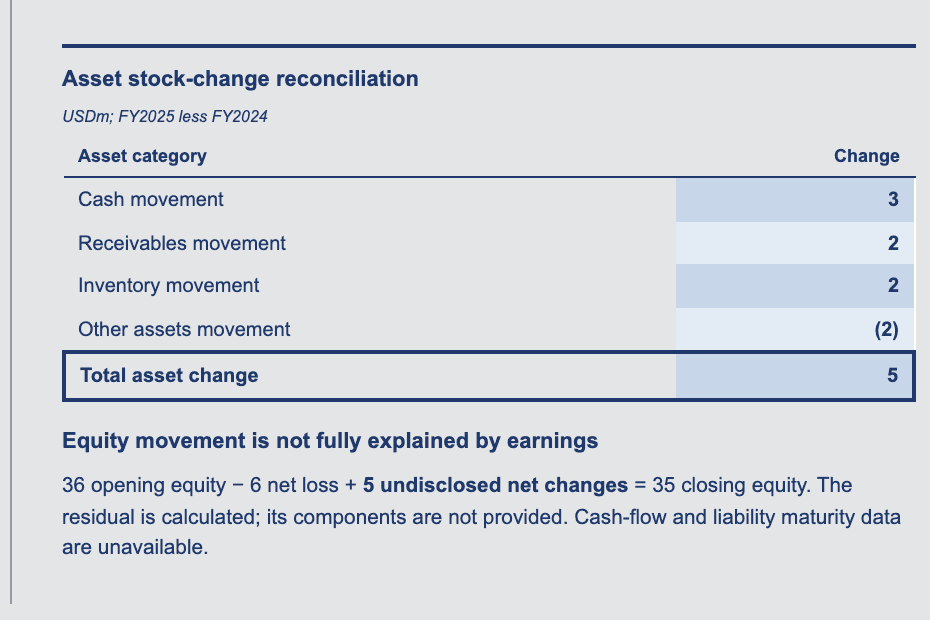
From the performance example: the residual that earnings cannot explain is stated, not balanced away. Refine a slide. Preserve the rest.
Revise the pages you name and leave the rest of the deck exactly as it was.
Every page is a self-contained unit with fixed layout and data rules, so changing one page does not move charts or conclusions on the others.
How It Works
Start with what you have.
You do not need a finished storyline. Bring the material you already have; the structure can be built from it.
01
Share the material
Send reports, filings, data tables or notes. The more specific the input, the less rework later.
You bringResearch and filing PDFs, financial data tables, existing decks, spoken points and judgements.
02
Agree structure and style
Fix the narrative order and page allocation first, then confirm the visual style, so detail changes stay cheap.
You bringSection order, page count per section, definitions and terminology, and the chosen style profile.
03
Review and refine
Read page by page and name what must change. Pages you do not name stay as they are.
You bringPage-level revision requests, additional data, and conclusions to keep or remove.
FAQ
Know the boundaries first.
These answers describe the creation, local storage and export features available today.
The workbench currently reads TXT, Markdown, CSV and PPTX files, and accepts written instructions. PPTX files are parsed by the authenticated server for text, tables and notes; slide layout and images are not imported, and legacy .ppt files are not supported.
Generation uses DeepSeek AI. Signed-in projects are saved to your PrimeDeck account and can be revised and exported as editable PPTX files. This browser keeps only input drafts and imported file copies.
This website is available in Chinese and English. Generated presentations follow your explicit language request; when you do not specify one, they follow the interface language.
The selected style profile keeps its layout rules, and each output is checked for readable typography, wrapping, labels and overall presentation in the target language.
The default output is editable HTML/SVG: text, tables and shapes remain editable, and changes can be limited to the pages you name.
PPTX is rebuilt by a separate worker rather than converted losslessly from HTML. A completed export includes the editable file, build source and quality report after its layout and object checks.
The validated deliverable is an HTML/SVG presentation, viewable in a browser and printable to PDF.
PPTX is rebuilt page by page as a separate worker task. A completed export includes the editable file, build source and quality report.
Start by making the request precise: scope of material, section page counts, style profile and revision rules — exported as one downloadable production brief.
Projects are saved to your PrimeDeck account after sign-in; this device keeps input drafts and imported file copies.